1
2
3
4
5
6
7
8
9
10
11
12
13
14
15
16
17
18
19
20
21
22
23
24
25
26
27
28
29
30
31
32
33
34
35
36
37
38
39
40
41
42
43
44
45
46
47
48
49
50
51
52
53
| import numpy as np
import matplotlib.pyplot as plt
from pylab import *
plt.figure(figsize=(8.3,6))
label_font = {'family':'Arial','weight':'normal','size':22}
legend_font = {'family':'Arial','weight':'normal','size':12}
plt.xlabel('Vacancy at n layer',label_font)
plt.ylabel('Vacancy formation energy (ev)',label_font)
plt.yticks(fontproperties = 'Arial', size = 18)
plt.xticks(fontproperties = 'Arial', size = 18)
plt.xticks(np.arange(1, 5.1, 1))
matplotlib.rcParams['patch.linewidth'] = 1.5
plt.rcParams['xtick.direction'] = 'in'
plt.rcParams['ytick.direction'] = 'in'
plt.tick_params(which='major',width=2,length=6)
bwith = 2
ax=plt.gca()
ax.spines['bottom'].set_linewidth(bwith)
ax.spines['top'].set_linewidth(bwith)
ax.spines['left'].set_linewidth(bwith)
ax.spines['right'].set_linewidth(bwith)
ms = 12
ld = 1.5
mew = 1
name = 'fig2_vfe'
style = 'pdf'
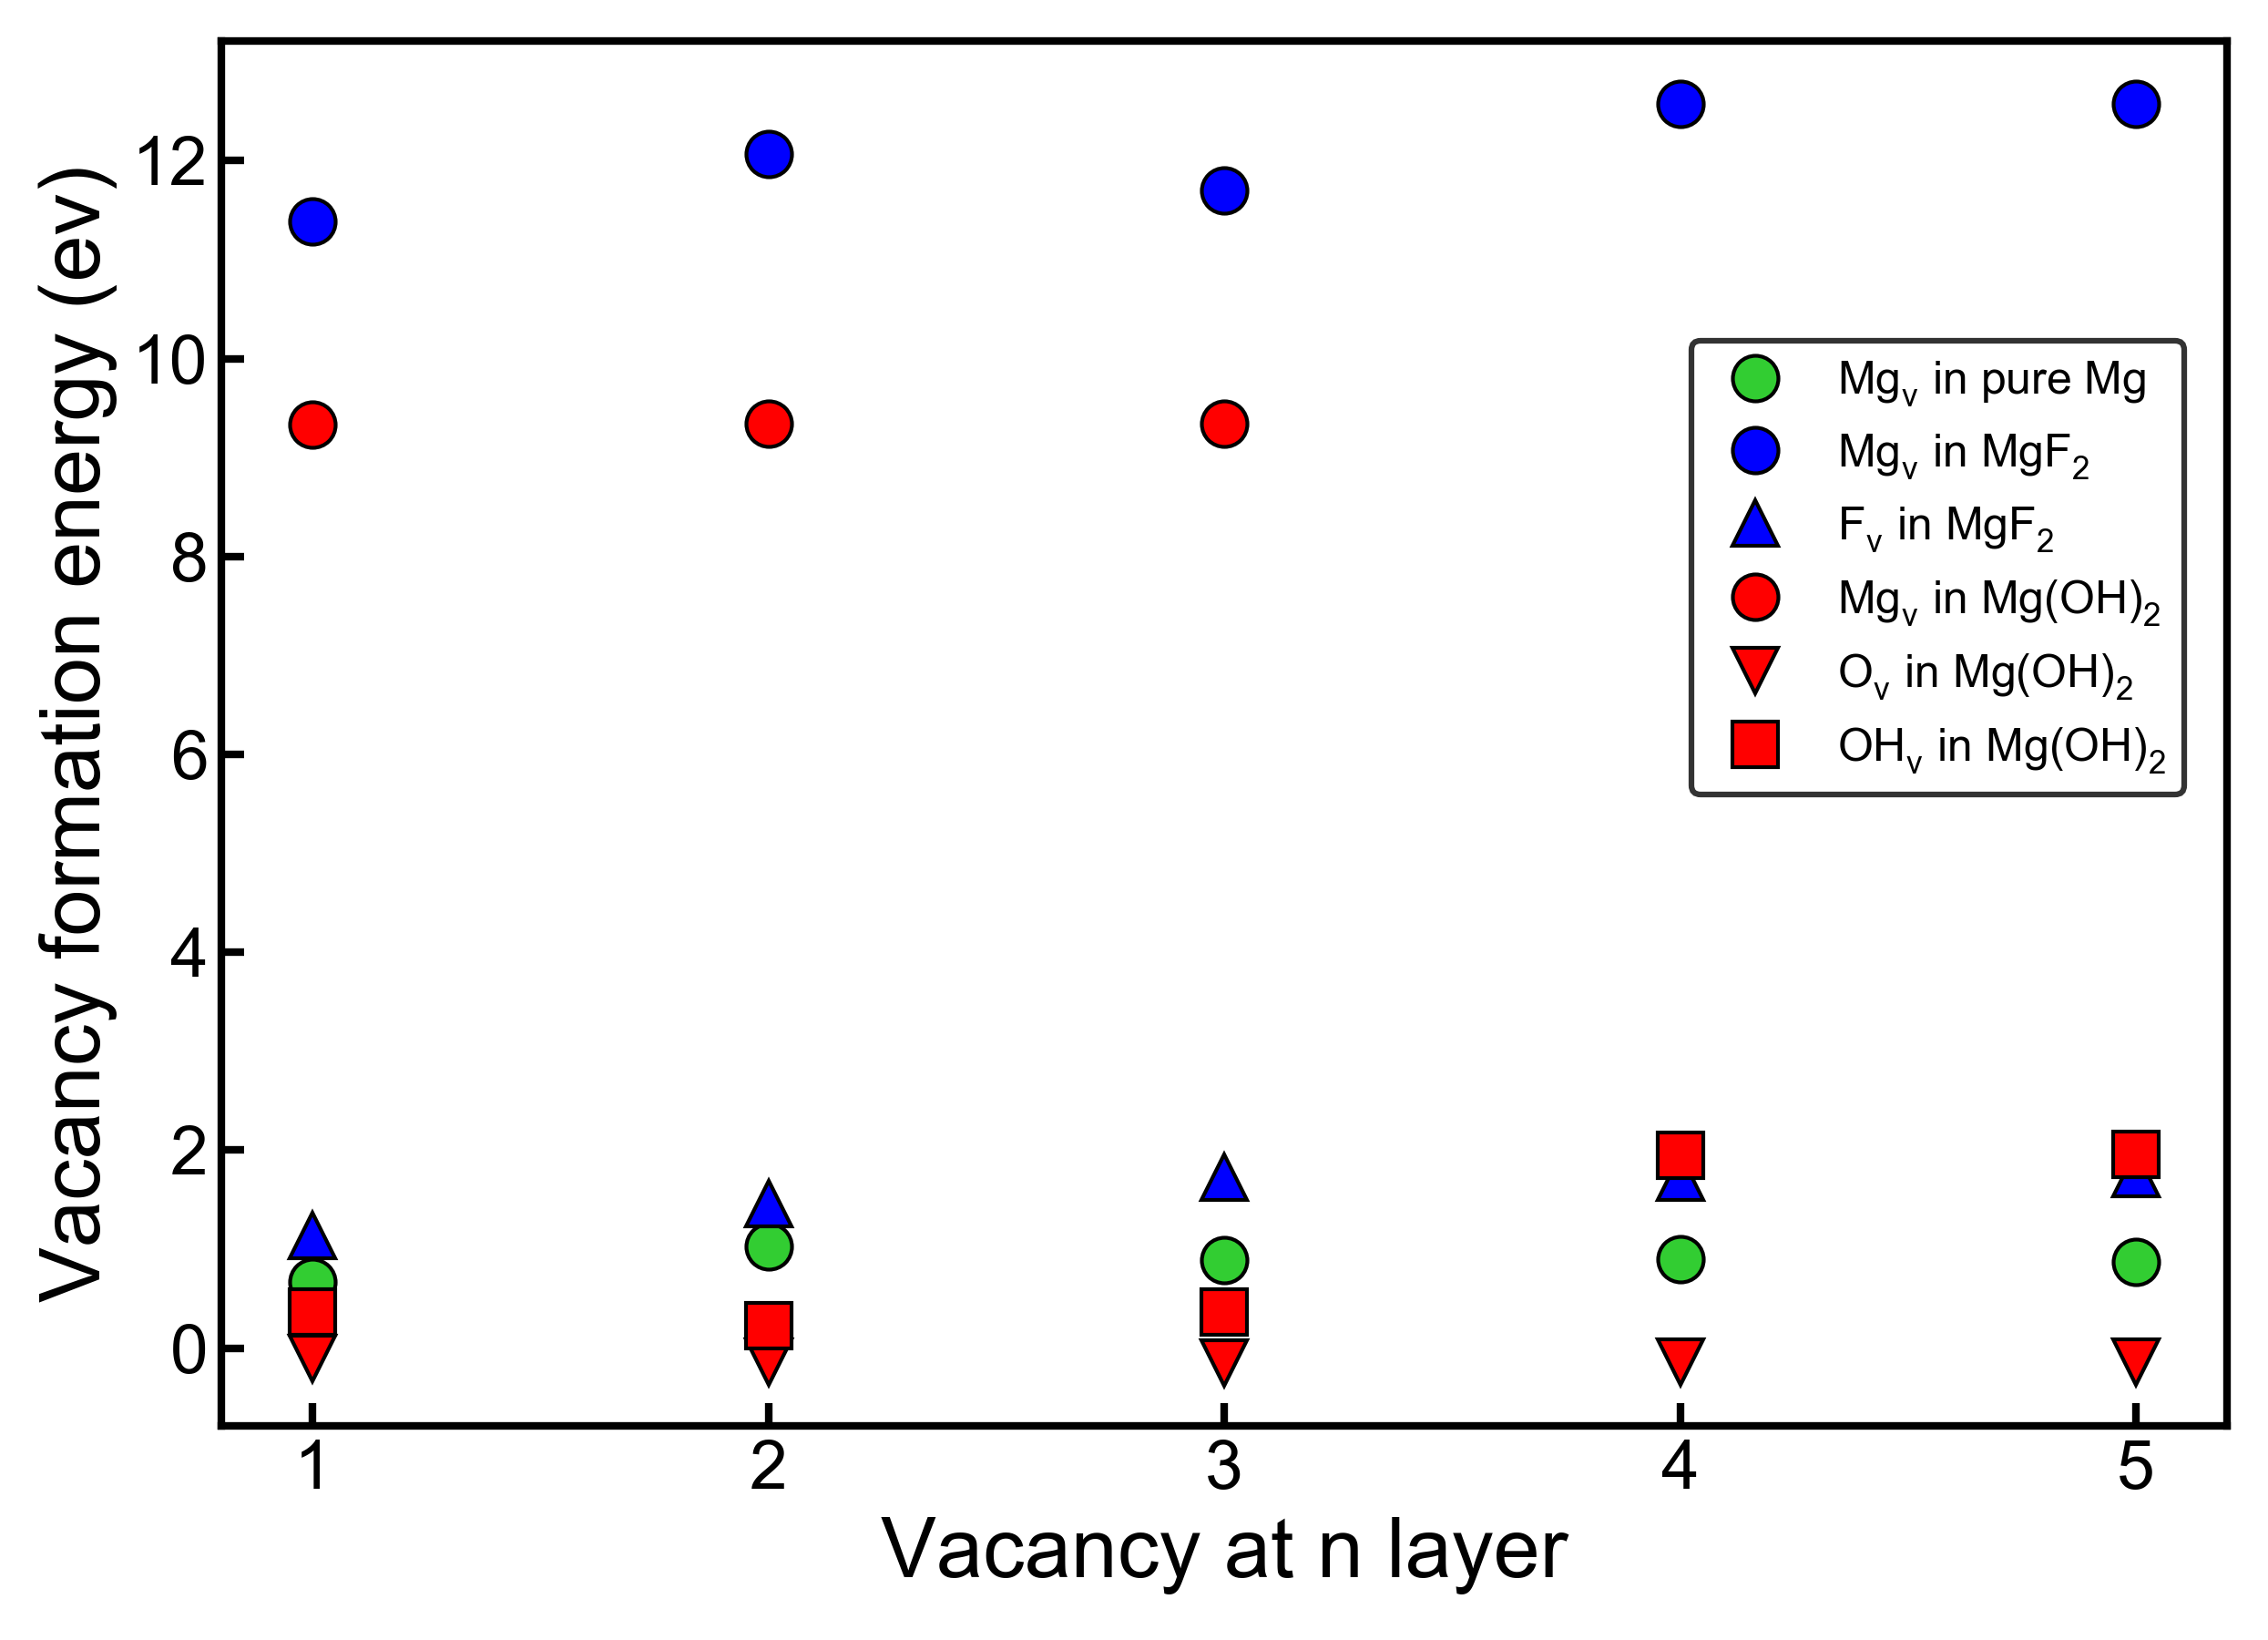
x = [1,2,3]
x1 = [1,2,3,4,5]
y1 = [0.672943,1.024707,0.891641,0.898325,0.868871]
y2 = [11.38964,12.06575,11.69664,12.57189,12.57274]
y3 = [1.13963,1.45938,1.72544,1.7293,1.76786]
y4 = [9.33593,9.3378,9.33955]
y5 = [4.17834,4.11902,4.11519,4.11813,4.11791]
y6 = [-0.09993,-0.14572,-0.1498,-0.14282,-0.14325]
y7 = [0.36766,0.22478,0.36611,1.94956,1.96229]
plt.plot(x1,y1,c='#32CD32',ls = '',marker='o',mew=mew, mec='black',lw=ld,ms=ms,label='$\mathregular{Mg_v}$ in pure Mg')
plt.plot(x1,y2,c='b',ls = '',marker='o',mew=mew, mec='black',lw=ld,ms=ms,label='$\mathregular{Mg_v}$ in $\mathregular{MgF_2}$')
plt.plot(x1,y3,c='b',ls = '',marker='^',mew=mew, mec='black',lw=ld,ms=ms,label='$\mathregular{F_v}$ in $\mathregular{MgF_2}$')
plt.plot(x,y4,c='r',ls = '',marker='o',mew=mew, mec='black',lw=ld,ms=ms,label='$\mathregular{Mg_v}$ in $\mathregular{Mg(OH)_2}$')
plt.plot(x1,y6,c='r',ls = '',marker='v',mew=mew, mec='black',lw=ld,ms=ms,label='$\mathregular{O_v}$ in $\mathregular{Mg(OH)_2}$')
plt.plot(x1,y7,c='r',ls = '',marker='s',mew=mew, mec='black',lw=ld,ms=ms,label='$\mathregular{OH_v}$ in $\mathregular{Mg(OH)_2}$')
plt.legend(loc='upper right',bbox_to_anchor=(0.99,0.8), prop=legend_font,edgecolor='black')
plt.tight_layout()
plt.savefig(name+'.pdf',dpi = 300)
plt.show()
|

